I’ve done several drafts of this post, and never settled on one in particular. They just got lost in the weeds. So today I’ll write the post that will finally be published talking about a project I’ve been keeping private for a while: The Clippy Performance Project!
What’s Clippy?
Clippy is the official Rust linter. A linter is a tool that serves to analyze and improve your code, commonly used within CI for ensuring consistency and good practices are maintained across a project.

And you may know me because one of two things:
- I’m a Clippy team member.
- I’m very focused on performance. We as developers should strive to deliver a product that any machine can run, not matter how much money its owner has spent on it.
So, a few months ago, I decided to mix these two traits and create a project that I call The Clippy Performance Project.
So, this blog post is the first part of a compilation of (almost) everything I discovered and worked on since then. In chronological order!
Phase 1: Creating benchmarking tools
We first started this journey by getting a new tool in our belt. SPEEDTEST is an environment variable that served us to execute the test suite many times over, averaging the times of all those runs. You can pair this with the TESTNAME environment variable to have per-test benchmarking.
SPEEDTEST=ui TESTNAME="<testfile to test>" cargo uitest
This tool was pretty primitive, but it made things like opening #12188 feasible and made a good starting point. Later, we could look into benchmarking Clippy using existing tools in the ecosystem’s tool belt. rustc-perf is that existing tool.
rustc-perf is our benchmarking tool and bot. It benchmarks every single commit done to rust-lang/rust so that people in the performance team can later triage and look for any regressions or big improvements.
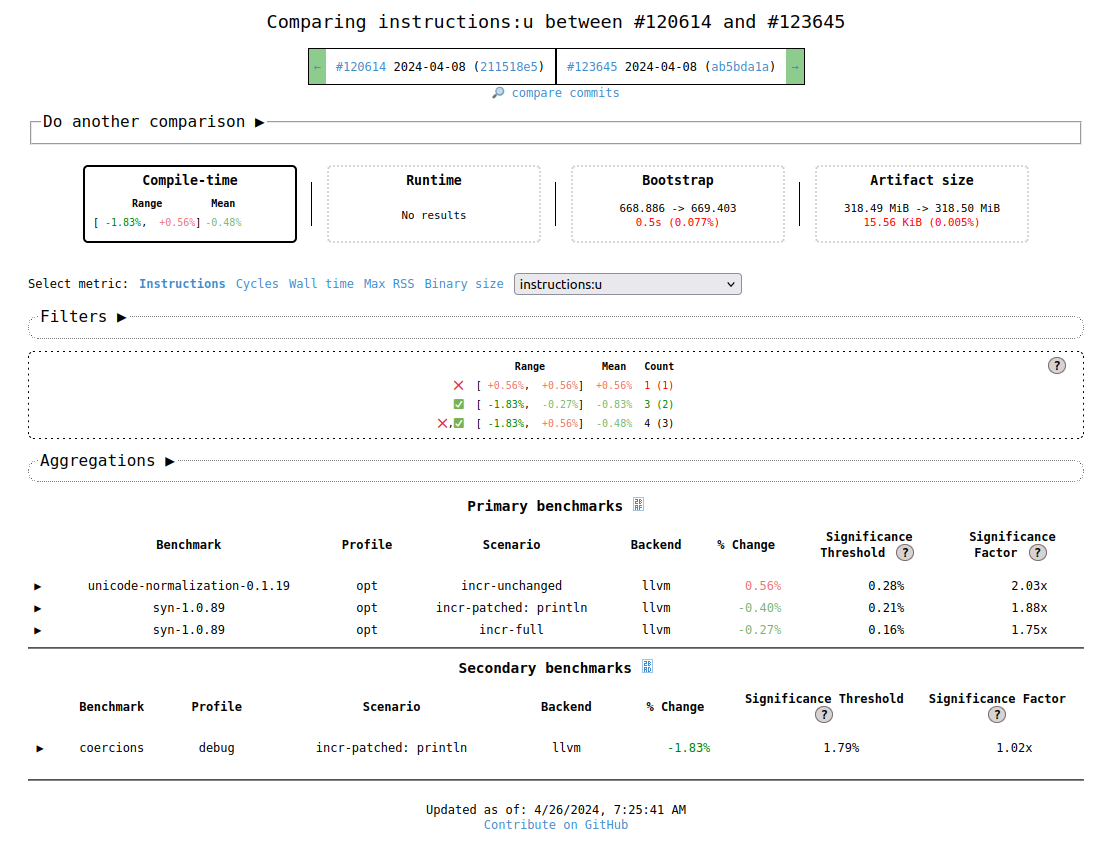
What if we could integrate Clippy with that workflow? That’s exactly the goal I set in this Zulip thread (among others). We achieved this after multiple conversations with mainly Kobzol, from the infra team, we achieved just that in rust-lang/rustc-perf#1724
After adapting our tool for benchmarking so that we could benchmark a Clippy PR, I decided to create a wrapper for the integration. Using the full command every time was… Uncomfortable to say the least. So after a few days of work, we had a new tool! becnh —yeah, the typo is intentional.
With the becnh script, we could change a pretty ugly sequence of commands (cloning clippy into a unique clone of rust-lang/rust, pull the changes from the desired PR and use a lengthy command to store the rustc-perf benchmark results) into this cool & clean command.
sh becnh 12453 span_lint_into_diag
… That’s it. It will import the relevant branch from #12453 to the Rust repo, build it and benchmark it. Pretty cool, I know.
Phase 2: Getting somewhere to benchmark + analyzing the results
The servers used for rustc-perf are not precisely under-utilized, and adding new code to the servers is a slow and painful process. So, after some deliberation, I decided to contact a server company and talk to them about the project… So now we have an additional benchmarking server, thanks to Cloudboxes.io!

Cloudboxes is the cloud provider that handed us a server to use our new tools and improve performance in the Rust compiler! ❤️
So, now we have a server that we can SSH into and perform some benchmarks with ~0.1% variance.
Yay :D
And that’s it for today’s post! Yeah, I know it was short & sweet, but I just wanted to get the meta-phases out of the question, so that in the next post we can go directly to the action. I’ll update this post when the next post in the series is done!
Thanks for reading!